So you’re on your way up north, feeling, most understandably, excited about seeing the Northern Lights. You get there and find out, “Wow! It’s cold!” Suddenly you realize… If there was a way to know exactly when the Northern Lights appear, I won’t need to spend too much time out in the bitter Arctic air.
This is a concern for anyone wanting to witness the majestic light show. Fortunately, there is a way to maximize your chances of seeing the Northern Lights. The good news is that it isn’t too difficult. You just need to know the numbers and what they mean.
Using any smartphone, you can download an app to get the appropriate data. Most of these apps are free and good enough to get it right (most of the time). Take a look at the list at the bottom of this article to see which ones we recommend.
Where does the data come from?
Probably your first and the most obvious question. The answer is simple.
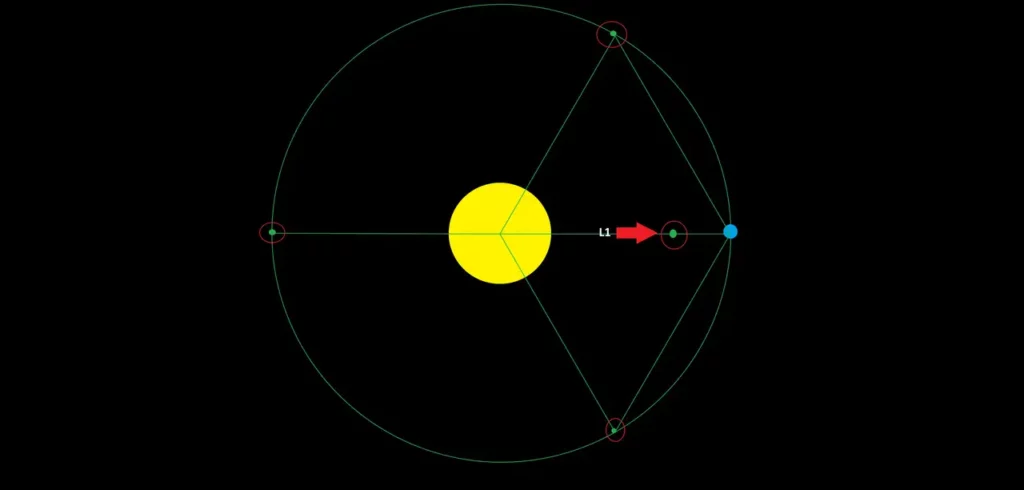
There is a satellite positioned between the Earth and the Sun. At a point called Lagrange Point 1 (L1) this point is exactly where the Earth’s and the Sun’s gravity have an equal effect. Causing a stable point at which the satellite can orbit around the Sun and remain roughly in the same place.
This allows us to collect data about the Sun’s behaviour. It is this data that the Aurora Apps pick up on and relay to you, giving you all the information you need to predict the Northern Lights.
The data shown in these apps looks, at first, quite alarming. But persevere. The data is quite easy to understand and very informative. The key to understanding this information is to know what to look for.
Auroras happen when gasses, expelled from the Sun, collide with the atmosphere. As these gasses pass by our satellite, it can detect the gas’s composition and relay that information to us. Then, just like any collision, three factors come into play when predicting their likelihood:
Direction, speed and frequency.
And so, we need to focus on these three aspects. When scouring through your app, pay close attention to the following:
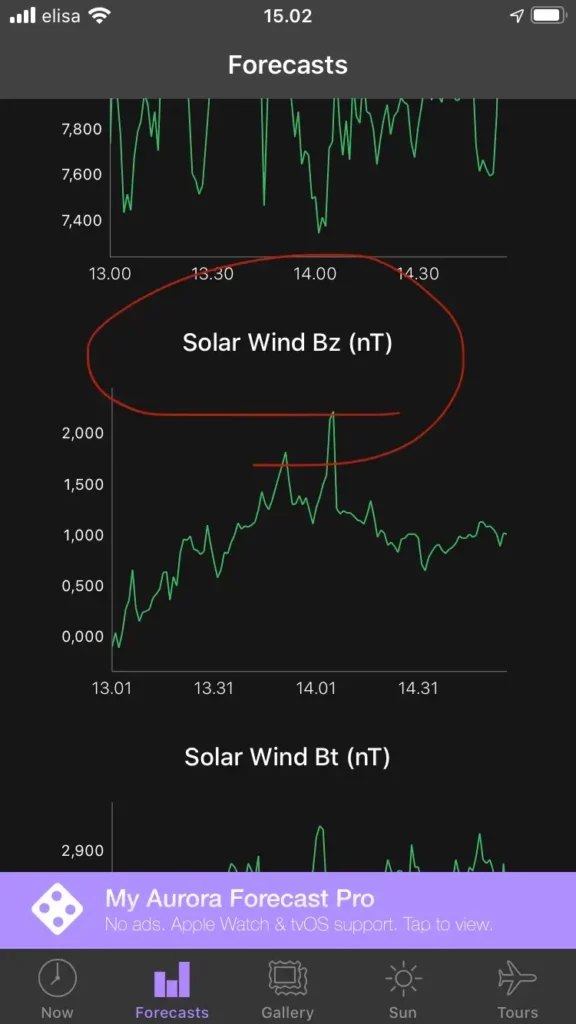
1. Solar Wind Bz
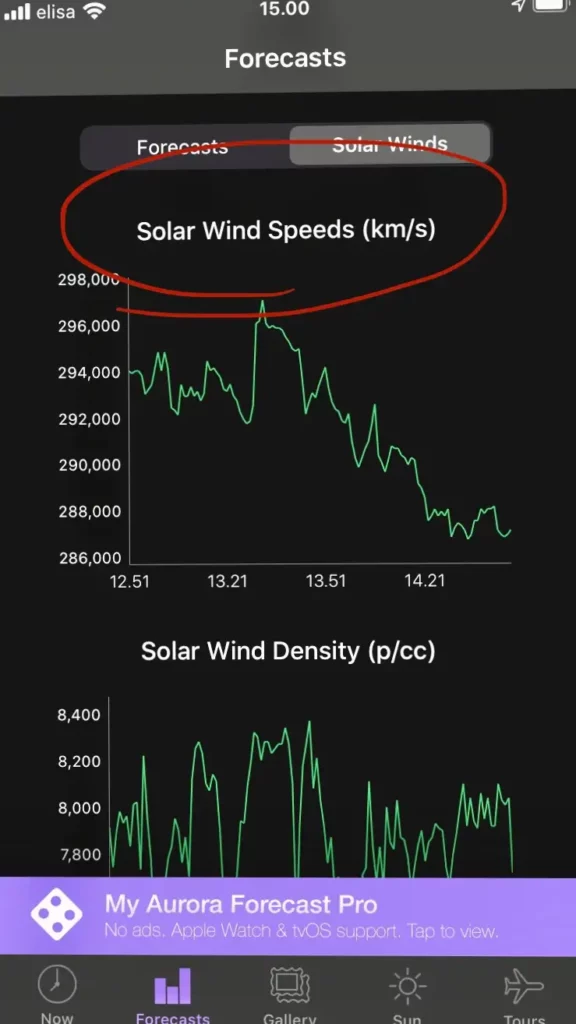
2. Solar Wind Speed
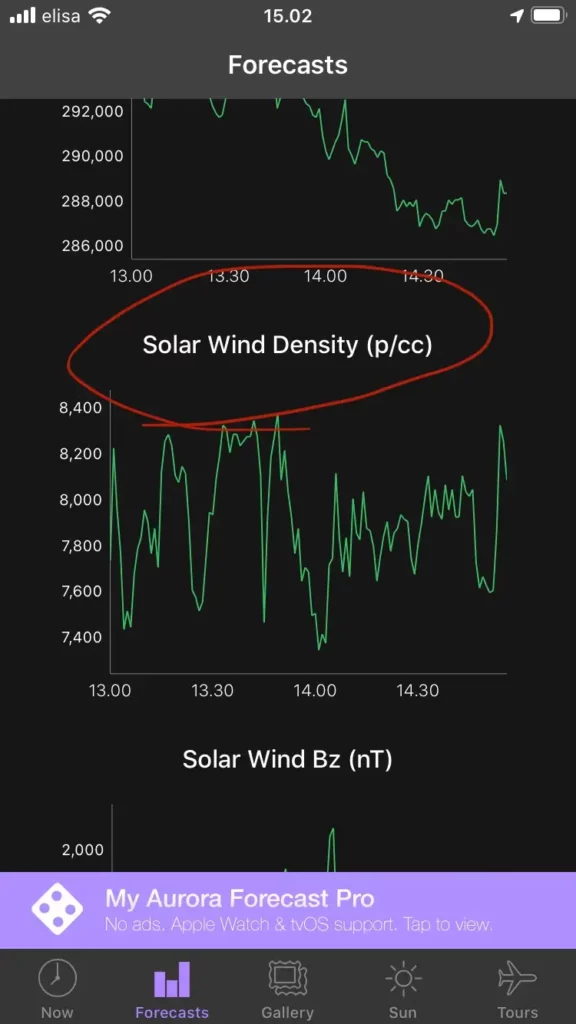
3. Solar Wind Density
The Solar Wind Bz is the polarity of the particles/gasses. As it is the Earth’s magnetic field which tries to deflect these particles, their polarity is essential as to whether they go North or South. Hence, Direction. The more negative the number the better for the Northern Hemisphere.
The Solar Wind Speed and Density are simple: the bigger, the better. More speed is more speed, and higher density means greater frequency of particles to cause collisions.
Time it Right
The trick to apply with all this data is to give approximately 30 minutes before you expect to see the changes take place. This is because the data is being collected by a satellite, millions of kilometres away from Earth. The gasses are not travelling at the speed of light, but the information the satellite transmits is.
Therefore there’s a delay that needs to be considered. Best guess is that it takes about 30 minutes (+/- a few minutes) from when the satellite transmitted the data to when those gasses will reach the Earth.
Interpreting the Data
Many Apps will offer some sort of KP Index rating. This is basically the amalgamation of all the data to give a score. This is often very generalistic and although it is a good indicator of high solar activity, without understanding the detail of the data, you can still be left in the cold waiting in vain.
None of this is perfect. And even a weak KP Index can have a surprise in the waiting. What this data does show is the highest likelihood Auroras will be seen.
Then of course, there are clouds to consider. However, there is a lot to be said for local knowledge, and with a guided tour, your chances of seeing the Northern Lights are always higher. Even on a cloudy day.
Links to Aurora Forecast Apps: